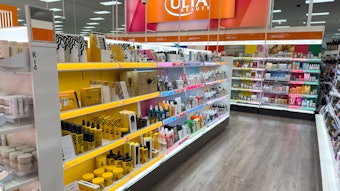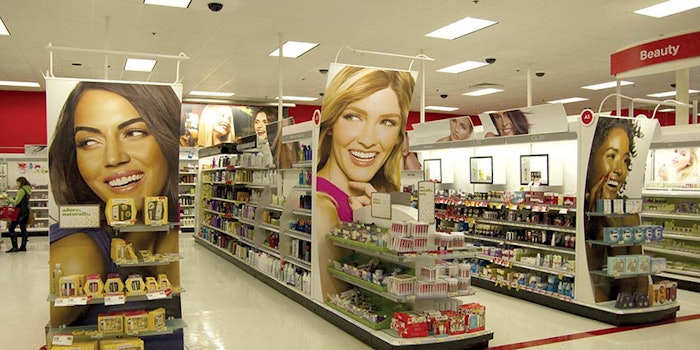
There’s often a gap between a brand’s merchandising plan and its execution, and gaining a clear understanding of that discrepancy’s impact on performance in real time is difficult. Now, a new insights program from Quri is looking to leverage real-time data to paint a clear picture of the retail reality for personal care, sunscreen and insect repellent brands.
Plan Vs. Reality
Retail can be a messy business. And the gap between brands’ plans and reality are becoming ever more complicated in the age of escalating SKUs, premiumization, diversified consumer bases and tech-enabled shoppers.
Stores may be contracted to carry merchandise, but is it being placed properly? Is every product variation or scent being presented? Is there a tag on the shelf? How many facings are the brands getting? Is the display plan being followed and does their quality meet expectations? Are brands getting the eye share and mindshare they planned for? Are their brand presentations being hurt?
In addition, brands must know whether stock is keeping up with high and low periods throughout the seasons. While retailers may do their best to provide inventory systems, they don’t provide the on-shelf reality confronting the consumer.
Getting a Clearer Picture
Now through Labor Day, Quri will leverage its Performance Driven Merchandising framework to measure overall display presence, display type and on-shelf availability details of several consumer product categories, including personal care (Dove and Colgate), sunscreen (Neutrogena, Coppertone and Banana Boat) and insect repellant (Repel and Off!).
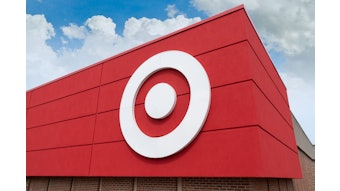
Conducted at 1,000 Walmart and Target stores monthly in the United States, a large flexible workforce will gather real-time, on-demand data using the EasyShift app, which gives Quri the speed and agility to capture large amounts of information as needed. The data will include photographs, providing analysts with an in-store view from their desks.
Quri notes, “Collected routinely in thousands of stores daily, this data provides the information currency needed to help manufacturer’s make routine, efficient improvements to the merchandising process across all functions at all levels of the organization including customer business teams, category management, brand management, trade planning and all major headquarter functions coordinating with these teams to hit annual sales and profit targets.”
Global Cosmetic Industry will present periodic insights drawn from Quri’s real-time performance tracking, providing an in-store view of how brands can optimize their spends and improve sales and margins in-cycle.
What’s Happening On-shelf
Quri’s first Summer of Merchandising data collection period took place over seven days, ending May 25, 2016. The data uncovered out-of-stock rates of 1–17% and off-self display presences of 16–74% in the period leading up to Memorial Day.
Drilling down, Quri’s data found that on-shelf availability (OSA) of insect repellant was very low (35%), which could be improved over the season, particularly in the wake of consumer fears over Zika virus and other insect-borne ailments.
Sunscreen and personal care brands posted OSAs of 71% and 81%, respectively, compared to top-performer carbonated beverages (97%). Out of stock percentage for personal care was 7%, and 3% for insect repellant. Out of stock rates were elevated for sunscreen, at 14%.
Everyday shelf tag presence for the categories was as follows: personal care (86%), sunscreen (78%) and insect repellant (35%). Again, repellant was markedly low compared to all other categories.
Promo tag presence for the categories was as follows: personal care (19%), sunscreen (25) and insect repellant (0%). Average number of facings per brand per store was 1.4 for personal care, 1.2 for sunscreen and 0.6 for insect repellant.
What’s Happening Off-shelf
Sunscreen boasted an off-shelf display presence of 74%, according to Quri’s data. Sunscreen had a large percentage—66%—of its displays outside expected aisles. While placement in unexpected aisles can create strong adjacencies, this is not a foolproof strategy.
Sunscreen had a high display presence (74%), while personal care and insect repellent were significantly lower, at 51% and 36%, respectively. Insect repellent had 58% of displays outside expected aisles, while personal care only had 39%. All three categories’ primary display vehicle was the endcap.
While the information gathered covers just one week, additional data accumulated over the coming weeks and months will paint a clearer image of how brands and categories are performing.
